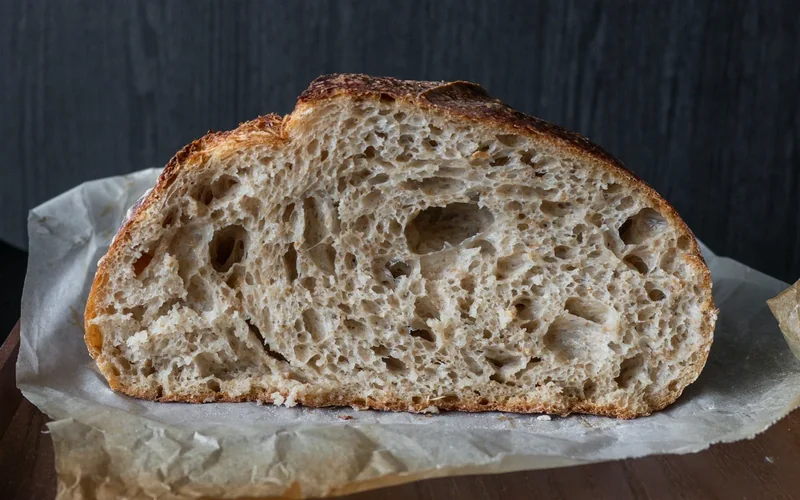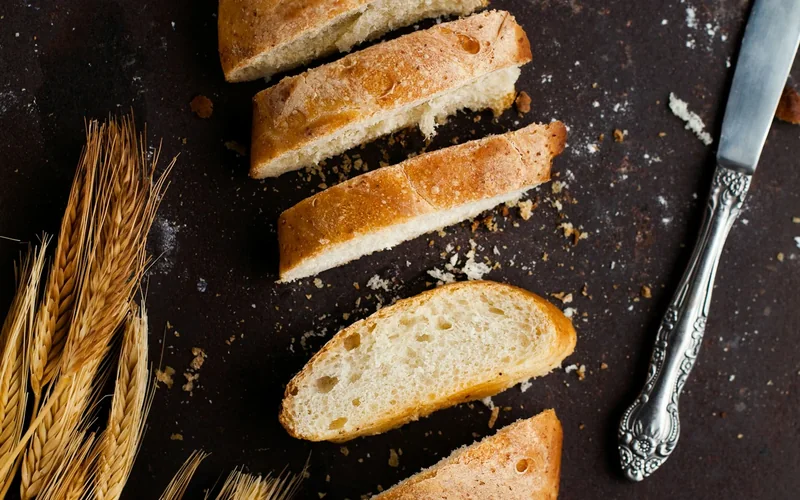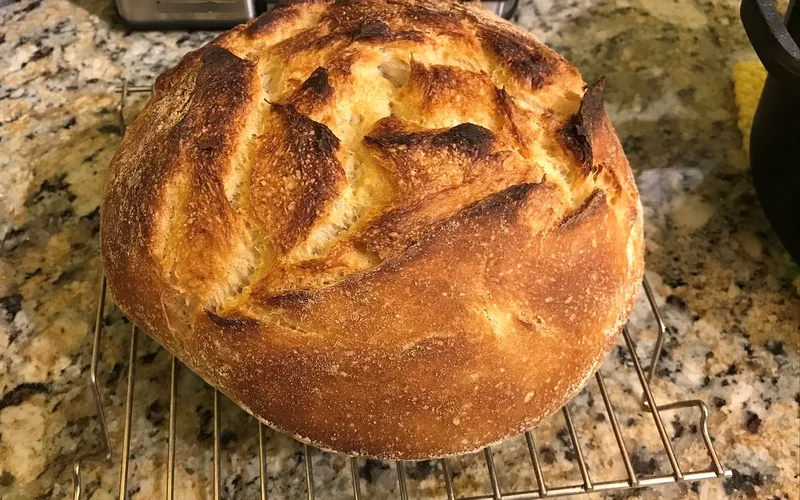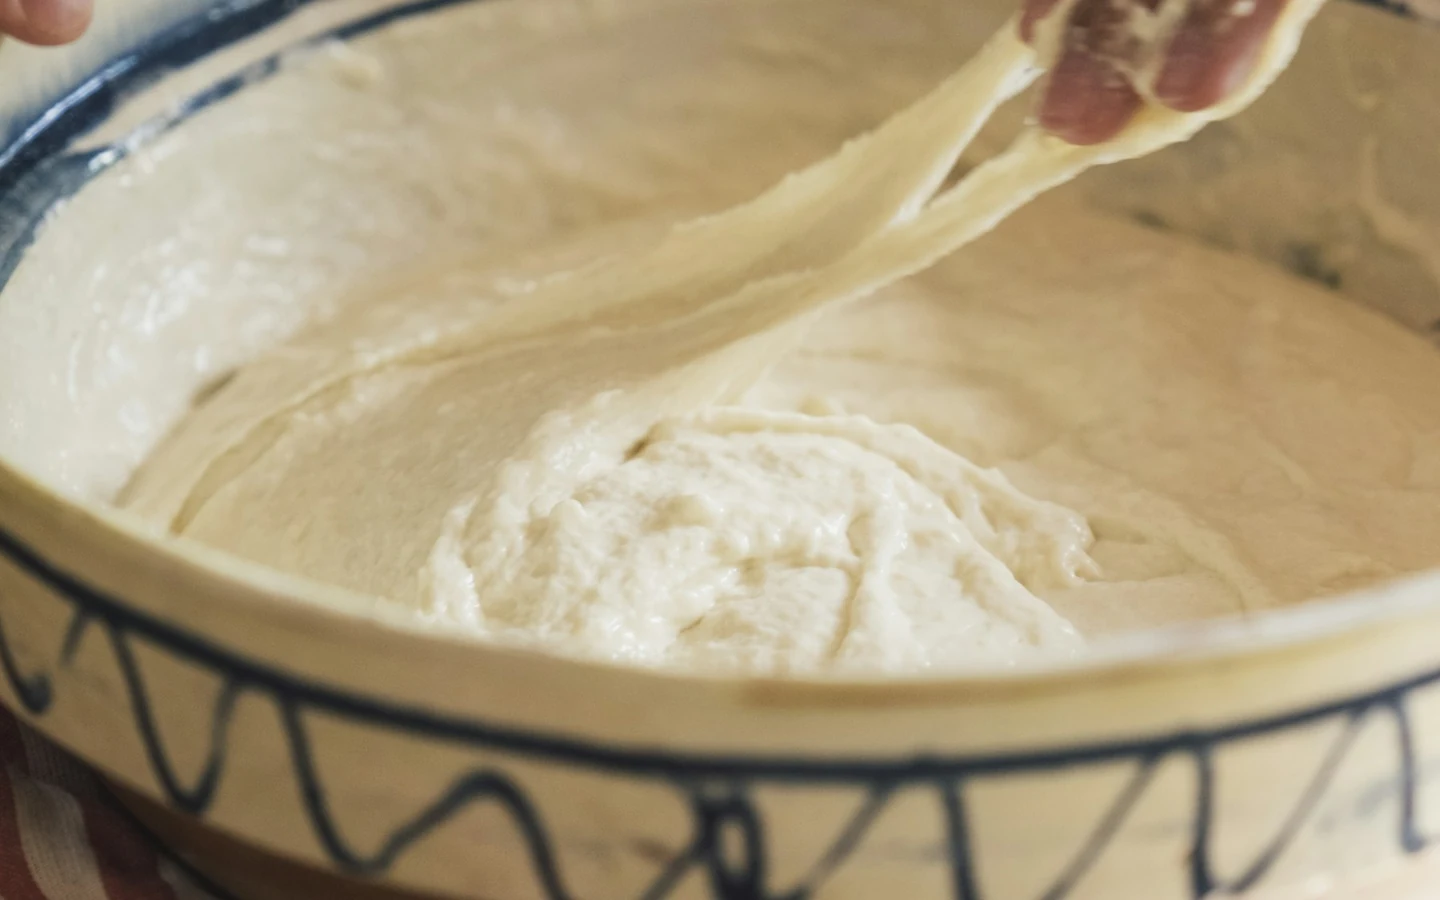
Hydration is the most-quoted number in modern bread writing and one of the least transferable. A recipe at 78 per cent hydration describes a dough that its author achieved with a specific flour. Given a different flour, the same figure produces a different dough, and there is a standardised measurement that explains why.
What water absorption formally means
The reference method is the farinograph, and the definition is precise. A 2023 study using a 50 gram mixer according to ICC method 115-D defines water absorption as the amount of water needed for the dough to reach a maximum consistency of 500 Brabender units, expressed as a percentage of flour at a 14 per cent moisture basis.
An independent Food Science and Technology Research study describes the same 500-unit target on a 14 per cent moisture basis, compares it with a small-sample mixograph method, and relates the measured absorption to breadmaking performance.
Three things in that definition are worth unpacking.
The target is a consistency, not a feel. 500 Brabender units is a fixed mechanical resistance, measured by the torque the dough exerts on the mixing blades. Different flours reach it at different water levels, and the water level is the reported result.
The reference basis is flour at 14 per cent moisture. Flour is hygroscopic, and its own water content varies with storage conditions, so absorption figures are normalised to a standard moisture content. Without that normalisation, the same flour would report different absorption in a damp month.
And it is a percentage of flour weight. That is the convention behind the baker's percentage notation, in which flour is always 100 and everything else is expressed relative to it. That notation is an industry convention rather than a standardised term with a formal definition I could locate, so the farinograph definition above is the anchor worth citing.
The result that undermines the usual assumption
Bakers generally expect higher protein flour to absorb more water, on the reasoning that gluten proteins bind water. The measured comparison in that study runs the other way.
Two einkorn varieties recorded water absorption of 52.7 plus or minus 1.5 per cent and 52.4 plus or minus 0.8 per cent. The common wheat recorded 58.8 plus or minus 0.6 per cent. That is a gap of roughly six percentage points in favour of the common wheat.
Their protein contents were 16.5 grams per 100 grams for the einkorns as a group against 10.5 for the common wheat. The flour with substantially more protein absorbed substantially less water.
Soluble pentosans do not rescue the simple story either. The einkorns had 1.03 grams per 100 grams against 0.85 for the common wheat, and pentosans are strongly water-binding, so on that count too the einkorns should have absorbed more.
The study measures these properties without isolating the cause of the absorption difference, so the mechanism is not established here. What is established is the negative result: protein content alone does not predict water absorption, and a flour specification listing protein tells you less about hydration than is generally assumed.
What the mixer tells you beyond absorption
The same instrument reports how the dough behaves once mixed, and those numbers matter for choosing a schedule.
Development time, the time to reach peak consistency, was 144 plus or minus 15 seconds and 168 plus or minus 23 seconds for the einkorns against 195 plus or minus 107 for the common wheat. Stability, how long the dough held near its peak, was 387 plus or minus 226 and 305 plus or minus 122 seconds against 429 plus or minus 234. Softening, the fall in consistency after the peak, was 65 plus or minus 20 and 85 plus or minus 15 Brabender units against 56 plus or minus 22.
The uncertainties on stability deserve attention. A mean of 387 seconds with a standard deviation of 226 covers almost the entire plausible range, so that particular comparison distinguishes very little. This is common in cereal rheology, where growing environment introduces large variation, and it is a reason to be wary of single-figure flour specifications generally.
Softening is the more interpretable of the three here. The einkorns softened more, at 65 and 85 units against 56, which is consistent with the wider description of ancient wheat gluten as plentiful but weak.
Absorption is not the same as the water you use
The study's bread-making trials used water at levels indicated by the 500 unit target rather than at the absorption figure itself: 56.0 per cent for the common wheat against 53.4 per cent for the einkorn.
That distinction matters in practice. Farinograph absorption is measured under specific mixing conditions on a small sample; a real dough with salt, a starter, a different mixer and a different intended handling window may need a different amount. The measurement provides a starting point and a comparison between flours, not a prescription.
The resulting loaves came out at 740 and 732 cubic centimetres for the einkorns against 671 for the common wheat. The flour that took more water gave the smaller loaf, which is a further reminder that hydration is a handling variable rather than a quality score.
What is not measured
I looked for the experiment every home baker would want: one flour, several hydration levels, with specific volume and crumb structure measured at each. In accessible literature I did not find it. Searches for hydration series against specific volume and crumb porosity returned almost nothing.
So the widespread claim that higher hydration produces a more open crumb, within a given flour, is not something I can support with a citation. It is consistent with mechanism, and it matches broad experience, and it has apparently not been published in a form a reader can check.
How to use a hydration figure
Treat a recipe's hydration as a starting estimate and adjust to a consistency, since that is what the standard measurement itself targets.
Do not infer absorption from protein content. The one direct comparison here shows a six point gap in the opposite direction to what protein predicts.
Ask suppliers for farinograph absorption if you can get it, and use it comparatively between flours rather than as an absolute figure to hit.
And when moving a recipe between flours, expect to change water by several percentage points, not by fractions of one. A six point spread between two wheats is larger than the difference between most hydration levels people argue about.