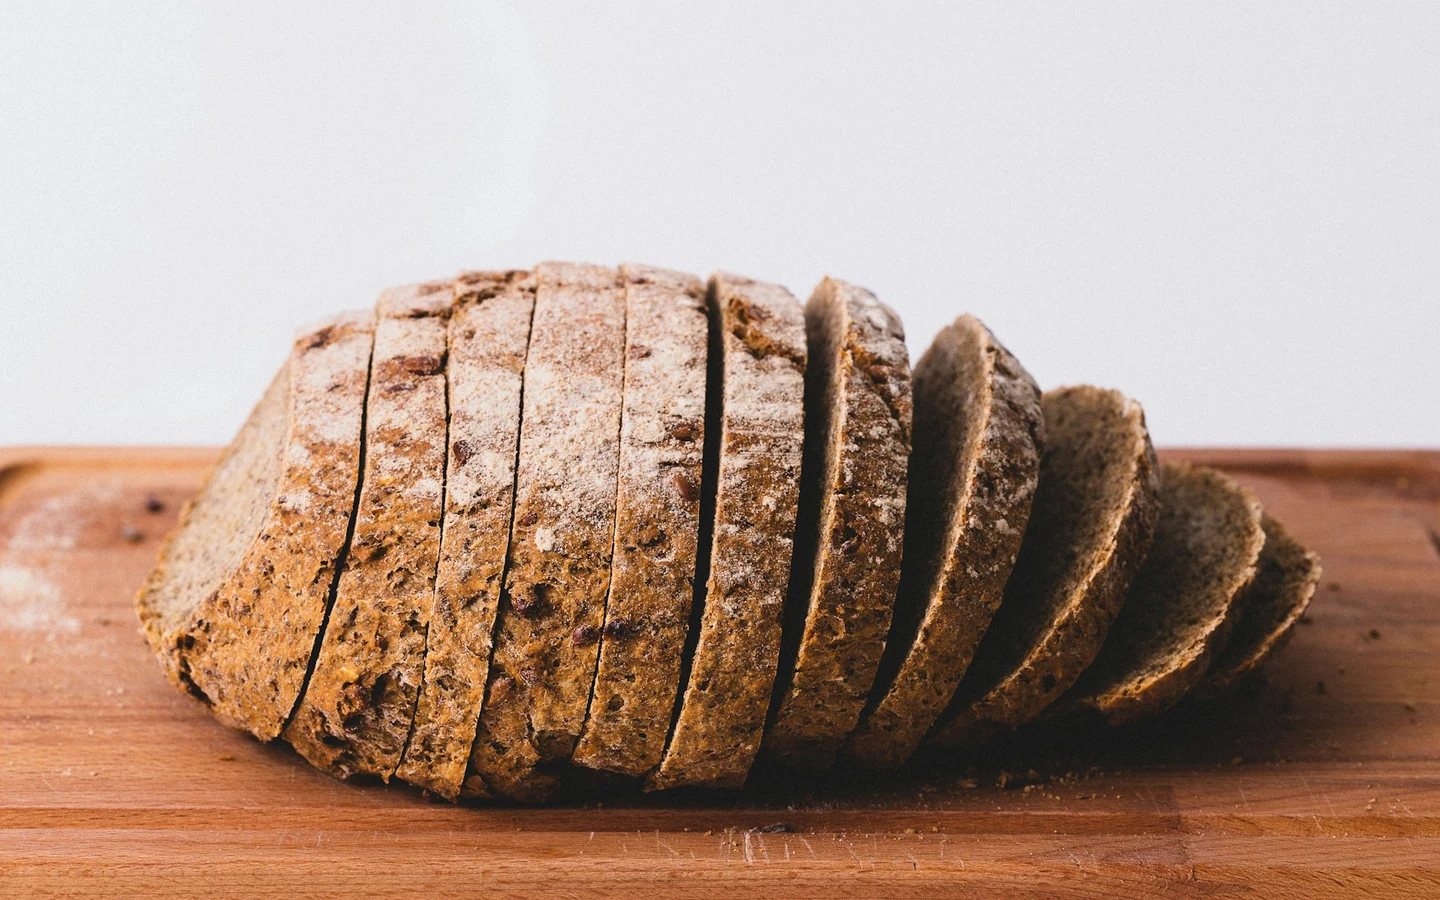
Photographs of sliced loaves circulate as evidence in baking discussions, and the vocabulary used to judge them, open, tight, even, irregular, is entirely qualitative. There is an established alternative. Crumb structure has been a subject of image analysis for years, and the parameters it extracts are specific enough to argue about properly.
The seven parameters
A 2018 review of image analysis for crumb characterisation lists what can be quantified from a slice:
- cell size
- cell size distribution
- number of cells per unit area
- cell wall thickness
- void fraction, that is porosity
- shape factor
- number of missing cell walls
Several of those do work that eye judgement cannot. Cell size distribution separates a crumb with uniformly medium cells from one averaging the same size through a mixture of very large and very small ones, and those two crumbs eat completely differently.
Shape factor captures elongation. Cells stretched in one direction indicate that the dough was under directional tension when the structure set, which is information about handling rather than about fermentation.
Number of missing cell walls is the most interesting entry, because it measures failure rather than form. A missing wall is a place where two cells merged, and merged cells are how large irregular holes arise. A crumb with big holes can therefore be described precisely: not as open, but as having a high count of missing walls.
The instrument is on your desk
The same review names the capture methods: two-dimensional high-resolution images from flatbed scanners and conventional photography, optical microscopy, and scanning electron microscopy.
It recommends the scanner route as fast, economical, and insensitive to external lighting. That last property is the one that matters. Photographs of crumb vary with ambient light, angle, and camera settings, which is precisely why comparing two people's crumb photographs is unreliable. A flatbed scanner supplies its own illumination at a fixed geometry, so two scans made weeks apart are comparable.
For anyone who wants to track their own baking rather than argue about someone else's, that is a practical route: scan a slice at a fixed resolution, and you have data rather than an impression.
Porosity is not volume
It is worth keeping two measurements distinct, because they are often conflated.
Loaf volume is a single number for the whole loaf. A 2023 study measured 732, 740 and 671 cubic centimetres for three varieties, which tells you how much the loaves expanded and nothing about how the space inside is arranged.
Porosity is the void fraction within the crumb. A 2026 study of gluten-free breads reported porosity values of 21.01 for a rice-based formulation against 17.17 for a chickpea-enriched one, alongside specific volumes of 1.93 and 1.65 respectively.
Those two measures moved together in that comparison, but they need not. A loaf can be large with a coarse structure, or compact with a fine even one, and only the pair of measurements distinguishes the cases. A caution on the figures: the porosity values in that paper are labelled with a volumetric unit that does not match the name porosity, so the numbers are best used as a relative comparison between the two formulations rather than as absolute void fractions.
The structure sets during the bake, not before
Understanding what the parameters describe requires knowing when the structure is decided, and a 2021 review of oven rise sets it out.
Dough initially contains gas cells that are not connected to one another, filled principally with carbon dioxide from the yeast. As gas is released and temperature rises, the cells come into contact with each other and the gas begins to interconnect. Expansion drives porosity upward. Gelatinisation, which the review places at around 60 degrees Celsius, is the transition at which dough becomes crumb.
So the crumb you measure in a scan is a snapshot of an event: which cells had grown, which had merged, and where the walls had thinned, at the moment the starch set. Missing cell walls are literally the record of mergers that happened before setting.
This is also why crumb structure is influenced by everything upstream. Fermentation determines how much gas there is to expand cells; hydration and flour properties determine how thin walls can get before rupturing; the bake determines how quickly the whole thing is frozen in place.
Texture measurements sit alongside, not instead
Structural parameters describe geometry. Instrumental texture describes mechanical response, and the two together are more informative than either.
The 2026 gluten-free study reported firmness of 6.15 newtons at day one for its rice-based bread against 15.92 for the chickpea-enriched one, rising to 10.51 and 24.46 newtons respectively by day seven. It also reported springiness of 0.82 against 0.78, resilience 0.45 against 0.33, and cohesiveness 0.75 against 0.62 at day one.
Notice that the coarser, higher-porosity bread was also the softer and more resilient one in that comparison. Structure and texture correlate, which is expected, but they are separate measurements and the correlation is not guaranteed to hold across different formulations.
What this means for a home baker
Three practical points.
If you want to know whether a change improved your crumb, scan a slice before and after under identical conditions. That converts an argument into a comparison.
Describe large holes as merged cells rather than as openness. It points at the mechanism, which is walls failing before the starch set, and therefore at the variables that could change it: hydration, fermentation extent, and how gently the shaped loaf was handled.
And separate the two questions of how much the loaf rose and how the space inside is organised. They have different causes and different remedies, and the single word open blurs them together. A loaf can be tall with a coarse merged structure, or modest with an even fine one, and the two faults call for opposite adjustments.